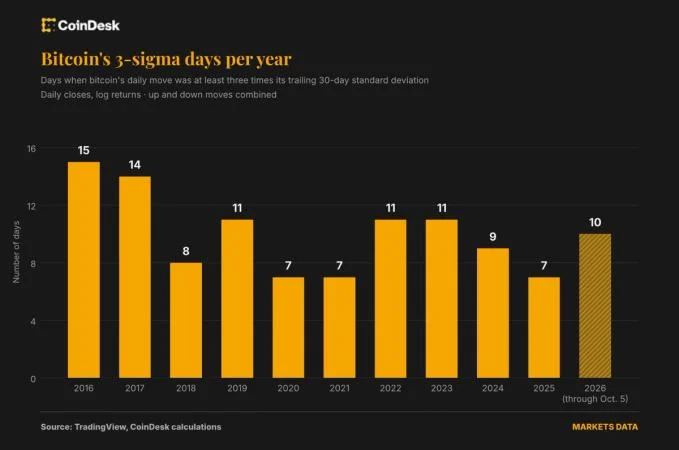
Bitcoin volatility has plunged compared to 2018 levels, but extreme price swings are now more frequent than they were during that turbulent year, CoinDesk analysis shows. The findings highlight a shift in how risk manifests in the maturing crypto market.
A review of 2026 trading activity identified ten unusually large trading days, suggesting that while average price movement has softened, outsized single-day jumps remain common. This mix of lower typical volatility and higher frequency of dramatic moves raises questions about how investors measure and manage risk in Bitcoin and broader crypto assets.
KEY FACTS
- Bitcoin volatility has decreased compared to 2018 levels.
- Extreme price swings are more frequent than in 2018.
- CoinDesk analysis counted 10 unusually large trading days in 2026.
- The data covers Bitcoin, Ethereum, Crypto News and Price Data.
- Findings raise questions about investor risk measurement in crypto markets.
The Story Behind the Numbers
What does ‘plunged volatility’ mean for day-to-day trading? Lower average volatility generally signals that most price changes are smaller, which can attract institutional capital seeking steadier returns. However, the presence of ten unusually large trading days in 2026 shows that sharp moves still punctuate the market, even if they are less constant than during 2018’s boom-bust cycle.
This combination matters because it affects portfolio construction, margin calls, and automated trading algorithms. Institutions often model risk using volatility metrics such as standard deviation or Value-at-Risk; if those models assume smoother price action but ignore the likelihood of sudden spikes, positions may be under-hedged against tail events.
Who Is Affected and How Did We Get Here?
Who is affected by this volatility pattern extends beyond retail traders. Hedge funds, custody providers, and corporate treasuries holding crypto assets all rely on volatility forecasts to price derivatives and set reserves. When extreme moves cluster more regularly than historical averages suggest, these players face unanticipated funding and liquidation pressures.
How did we get here traces back to several market developments. Growing institutional participation, the launch of U.S. spot ETFs, and evolving regulatory clarity have stabilized baseline trading ranges. Yet macroeconomic shocks, geopolitical tensions, and large holder activity continue to trigger episodic spikes, producing the very trade days that CoinDesk flagged in 2026.
WHAT WE KNOW — AND WHAT WE DON'T
Verified by the source:
- Bitcoin volatility has declined relative to 2018.
- Extreme price swings occur more frequently than in 2018.
- Ten unusually large trading days were counted in 2026.
Still unconfirmed:
- The exact magnitude of the volatility drop from 2018.
- Which specific dates or events caused the ten large trading days.
- Whether any single institution or macro factor drove the trend.
- Forward-looking investor responses to the new volatility regime.
WHY IT MATTERS
Bitcoin volatility remains a key input for portfolio managers weighing crypto exposure, and a pattern of lower average swings paired with frequent extremes complicates traditional risk models across trading-crypto and economy-markets strategies alike.
WHAT TO WATCH
Upcoming volatility reports and derivative market open-interest data may clarify whether the frequency of extreme days persists through the rest of 2026. Meta description: CoinDesk analysis finds Bitcoin volatility down since 2018 while extreme price swings rise, with ten unusually large trading days counted in 2026.